Each year, the Australian Taxation Office (ATO) publishes a snapshot of the 14.7 million individuals who lodge tax returns. Many returns are not lodged on time, so the latest data is for FY2019, but it reveals some surprises. The ATO also summarises some of the demographics of taxpayers (and non-taxpayers).
We are heading into a period of opening up the economy after COVID, with the need to repair the budget, an election looming by May 2022, the threat of inflation and a withdrawal of central bank stimulus. Any policy steps should recognise who pays the bills and who owns the assets.
For every 100 Australians lodging returns:
 At the other end of the scale, 3.5% of people pay nearly one-third of personal taxes, and another 15.6% pay 36%. That means less than 20% of people pay two-thirds of personal income tax.
That’s our system, but policy and society need to recognise that, as it should be, high-income earners provide the services for low-income earners.
The ATO provides a further breakdown by ranking the 100 people by their taxable incomes:
At the other end of the scale, 3.5% of people pay nearly one-third of personal taxes, and another 15.6% pay 36%. That means less than 20% of people pay two-thirds of personal income tax.
That’s our system, but policy and society need to recognise that, as it should be, high-income earners provide the services for low-income earners.
The ATO provides a further breakdown by ranking the 100 people by their taxable incomes:
 In total, the gross rental income of almost $50 billion (thank you, renters!) is offset by a slightly larger amount of capital works deductions and other rental deductions (mainly mortgage interest) to produce a net loss for the 2.2 million people overall.
It’s thoughtful of tax policy to allow the loss to be charged immediately against income rather than the treatment of business losses which must be carried forward and charged against future profit.
In total, the gross rental income of almost $50 billion (thank you, renters!) is offset by a slightly larger amount of capital works deductions and other rental deductions (mainly mortgage interest) to produce a net loss for the 2.2 million people overall.
It’s thoughtful of tax policy to allow the loss to be charged immediately against income rather than the treatment of business losses which must be carried forward and charged against future profit.
 The main reason is not that younger people on lower salaries represent a high proportion of SMSF members. Rather, super funds are legal entities and tax is paid within the fund rather than being passed into an individual's taxable income. A person may operate a $10 million SMSF but have little in personal income.
Graham Hand is Managing Editor of Firstlinks.
The main reason is not that younger people on lower salaries represent a high proportion of SMSF members. Rather, super funds are legal entities and tax is paid within the fund rather than being passed into an individual's taxable income. A person may operate a $10 million SMSF but have little in personal income.
Graham Hand is Managing Editor of Firstlinks.
- 10 are from Generation Z (born from 1996 to 2009)
- 35 are from Generation Y (born from 1980 to 1995)
- 31 are from Generation X (born from 1965 to 1979)
- 19 are from Baby Boomers (born from 1946 to 1964)
- 4 are from the Silent Generation (1945 or earlier).
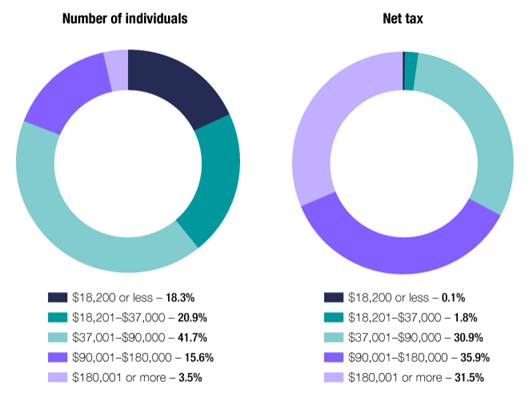
1. Who pays tax?
Every decision on tax rates and welfare involves a trade-off which requires wealthy people to support poor people. That’s part of a fair society and a progressive tax system. At a high level, those who have look after those who have not. There are infinite nuances. What about people who are able to work but choose not to? Should they be supported? That is why Centrelink has rules that some welfare recipients need to demonstrate they have tried to find employment. The data below shows nearly 40% of individuals pay only 2% of personal income taxes. Many of these would also receive welfare so many people make no net contribution to government revenue (ignoring other taxes such as GST).
At the other end of the scale, 3.5% of people pay nearly one-third of personal taxes, and another 15.6% pay 36%. That means less than 20% of people pay two-thirds of personal income tax.
That’s our system, but policy and society need to recognise that, as it should be, high-income earners provide the services for low-income earners.
The ATO provides a further breakdown by ranking the 100 people by their taxable incomes:
- the top 3 paid 29% of all net tax
- the next 6 paid 19% of all net tax
- the next 31 paid 40% of all net tax
- the next 35 paid 12% of all net tax
- the final 25 didn't pay any tax.
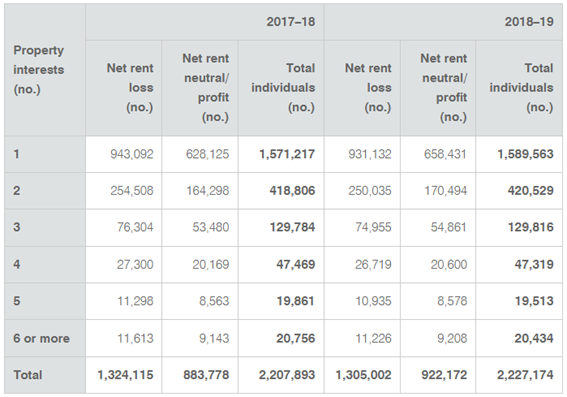
2. Investment properties
Let’s turn to assets, with most household wealth held in residential property, soon to top $10 trillion after the recent price surge compared with about $3.2 trillion in superannuation. Over 2.2 million Australians own investment property. That’s a lot of people enjoying the current housing boom (in addition to owners of Principal Places of Residence). Over 20,000 own six or more properties and it’s party time funded by low interest rates. Of the 2.2 million, about 60% or 1.3 million claim a net loss, which can be charged against other personal income.
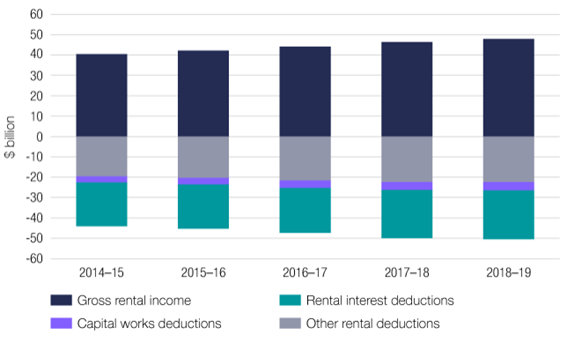
In total, the gross rental income of almost $50 billion (thank you, renters!) is offset by a slightly larger amount of capital works deductions and other rental deductions (mainly mortgage interest) to produce a net loss for the 2.2 million people overall.
It’s thoughtful of tax policy to allow the loss to be charged immediately against income rather than the treatment of business losses which must be carried forward and charged against future profit.
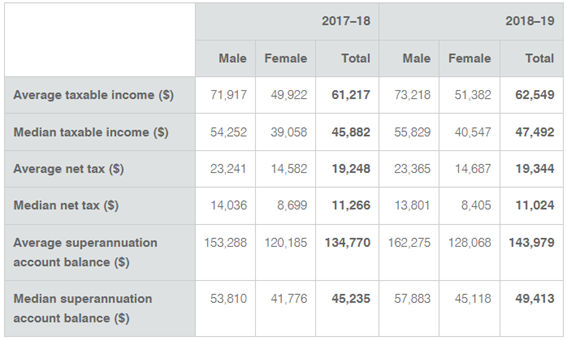
3. Taxable incomes
For FY19, the average taxable income was $62,549. As this number is inflated by some very high earners, a more representative number is the median (as many people above the number as below) of $47,492. This number is worthy of a moment’s reflection. Half of Australians earn less than $48,000 a year. While this number includes many who are asset rich/cash poor (retirees, superannuants, owners of valuable properties on age pensions, etc), there are millions not earning the big bucks who are renting and not participating in surging property and stock markets.
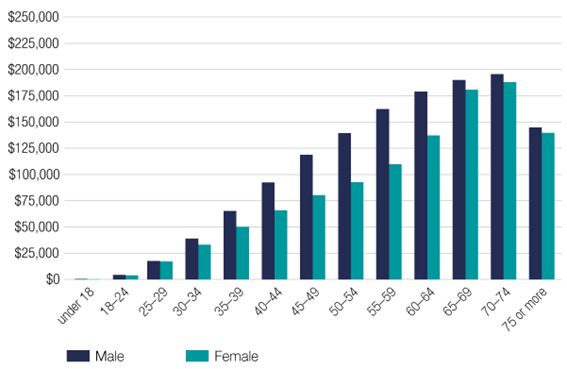
4. Average superannuation balances by age
Most people do not have much in superannuation, with the median stated at less than $50,000 (and women $45,000), as shown above. This disguises balances by age. Obviously, older people have more super. Most have been in the system longer, have benefitted from compounding and good market returns, earn more than younger people with more opportunities to contribute extra. But even for people aged 65 and over, average superannuation balances of less than $200,000 will only finance a decent retirement if there are other assets such as owning a home and investments outside super.
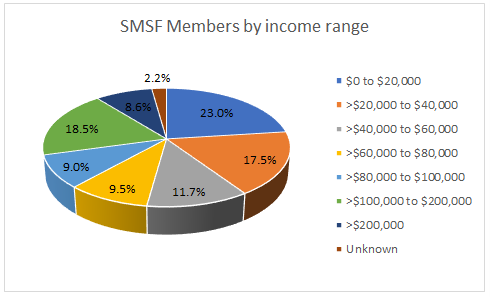
5. SMSFs
Turning to another ATO report, the SMSF statistics for June 2021, reveals there are almost 600,000 SMSFs with over 1.1 million members holding assets of $822 billion. The top two asset types are direct holdings of listed shares (28% of total SMSF assets) and cash and term deposits (18%). In addition:- 86% of SMSF members are 45 years or older
- the average assets per SMSF member were $696,000
- the average assets per SMSF were $1.3 million
- member contributions into SMSFs were $12.6 billion
- employer contributions into SMSFs were $5.4 billion
The main reason is not that younger people on lower salaries represent a high proportion of SMSF members. Rather, super funds are legal entities and tax is paid within the fund rather than being passed into an individual's taxable income. A person may operate a $10 million SMSF but have little in personal income.
Graham Hand is Managing Editor of Firstlinks. 

