Introduction
One of the better economic aphorisms is “a rising tide lifts all boats”, which suggests a growing or expanding economy will benefit all participants and so economic policy, particularly that of government, should focus on the big picture rather than pork barreling. If only.
Berkshire Hathaway’s Warren Buffett added—“only when the tide goes out do you discover who’s been swimming naked”.
So as the economic tide ebbs, those skinny dippers are likely to be exposed during the latter half of 2023 and into 2024. They comprise households, companies, and lending institutions, including the buy-now-pay-later (BNPL) cohort. Lending borrowers six times stated income at the bottom of an interest rate cycle, when rates were at historical lows means there will be casualties. The credit providers and borrowers in the Grand Daddy of Australia’s BNPL market—the home mortgage market—will also be impacted. It is the epitome of BNPL!
After aggressive monetary policy tightening programs of global central banks, the skinny dippers’ wake should now be in full swing. Many forecasters predicted a year ago a recession was likely in some form during 2023. New Zealand has experienced a technical recession with negative consecutive quarterly GDP readings of -0.7% and -0.1% for 4Q22 and 1Q23, respectively. So has the Eurozone. Most other developed world economies have so far avoided an extended contraction, although Germany teeters.
The massive fiscal stimulus packages of 2020 and 2021 swelled household savings as the pandemic shutdown economies. Severe restrictions and lockdowns to stop the spread of the COVID-19 virus severely limited spending options. Delta and Omicron variants extended inconveniences well into 2022. China only fully relaxed restrictions in January 2023.
Exhibit 1: Markets Snapshot 30 June 2023
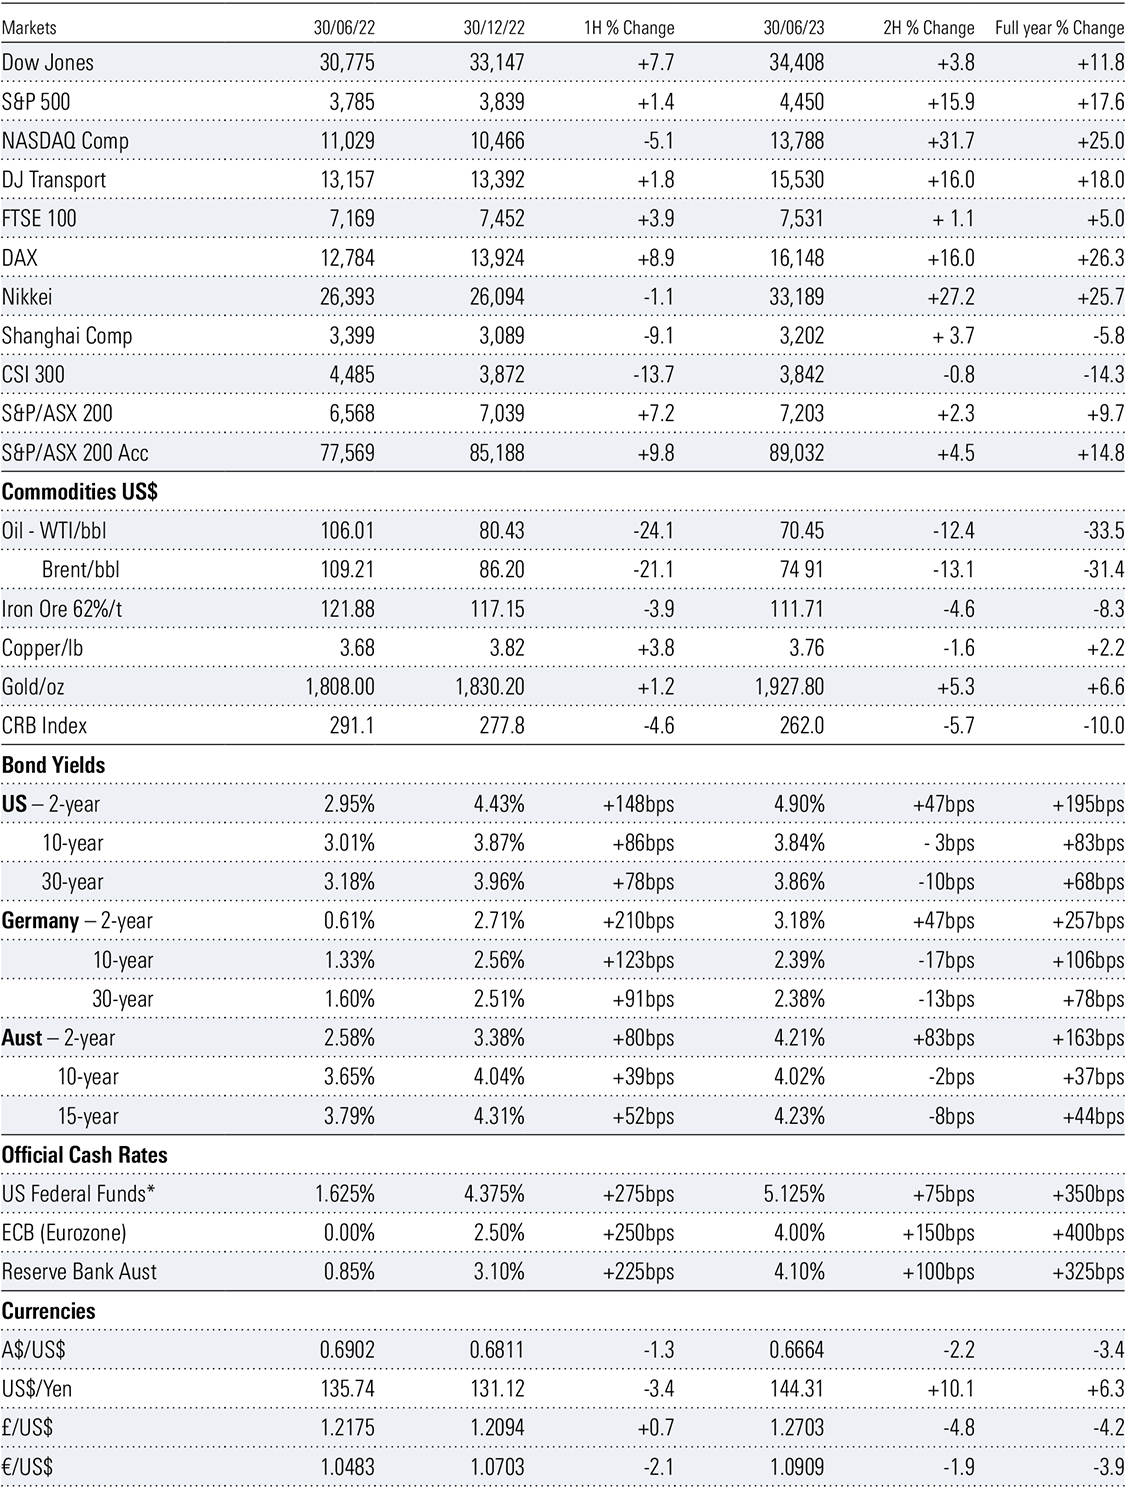 *Midpoint of range.
Source: Morningstar
*Midpoint of range.
Source: Morningstar
In addition to fiscal largesse supporting households, the demand for goods and services from a corralled population, except for travel and hospitality, saw a strong rebound in job creation and sent unemployment levels to record lows.
Meanwhile, due to the most accommodative monetary policy settings in history, zero-bound interest rates became the norm. Negative bond yields also became commonplace. The financial system was awash with liquidity and its price at bargain levels.
Global central banks from as far north as Scandinavian Norway to the southern antipodes of Australia and New Zealand have been on a year-long monetary tightening exercise to halt the march of the inflationary army. While there have been varying degrees of success, most of the wins have come from the supply side, as supply chains have freed up from widespread pandemic disruption and labour forces have resumed to a more normal work environment. Monetary policy has little or no impact on supply-side issues.
Developed economies are still fighting a battle against inflation, particularly in the services sector. With the impact of aggressive monetary policy tightening having been delayed, financial markets are climbing a wall of worry dotted with obstacles, including a sharp fall in consumer spending, as the full extent of the past year’s rate hikes adds to the toll of meaningful increases in cost-of-living expenses sapping consumer confidence and savings.
Uncertainty surrounds the outlook for household consumption and the knock-on effect to corporate cash flows and profitability should not be underestimated. Rising unemployment is likely as companies trim operating costs to protect margins. The impact of the mortgage cliff is much greater in Australia with the short three-to-five-year tenure of fixed loans. In the US, 30-year fixed loans are the norm and consequently the added demands on household disposable income from rising interest rates is significantly diluted.
The central banks are nearing the end their respective rate hike programs. One, perhaps two more increases are likely before time is called. Markets will then start looking for the first signs of a cut. With core inflation unlikely to return to respective target levels until late 2024–mid 2025, significant cuts are unlikely in 2024. There is a paradigm shift. Gone are the days of zero-bound interest rates and hopefully another unforeseen event will not see a repeat of the recent fiscal flood. Simply put, the situation will normalise.
Recall, Australia’s average official cash rate between 1990 and 2023 is 3.85%, just 25-basis points below the current mark. The average US federal funds rate between 1971 to 2023 is 5.4% against the current mid-point of 5.125%. History will show the period between 2020 and 2022 was an aberration. Get used to the normalisation of the economic cycle, probably starting in 2024.
Exhibit 2: Australia interest rate (%)
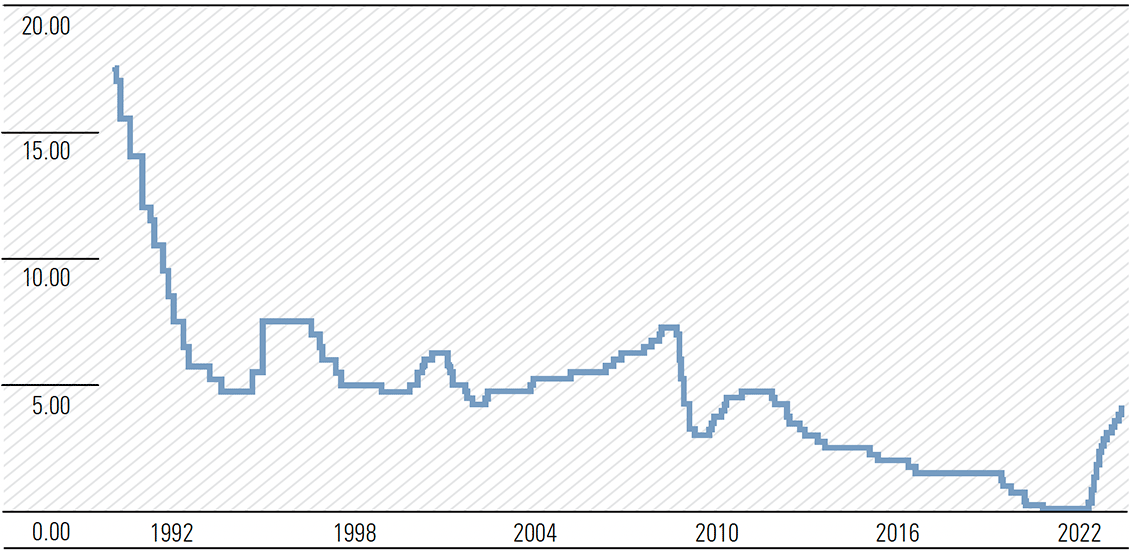 Source: www.tradingeconomics.com, Reserve Bank of Australia
The reward for reaching the summit of the Wall of Worry—1st: A Soft Landing/Mild Recession; 2nd: A period of stagflation, possibly extended.
AUSTRALIA
Challenges ahead as the economy starts to normalise
The Australian economic tide has been ebbing since late 2022 and the contraction in economic activity is likely to continue well into the June half of 2024. GDP growth slowed to 0.2% in the March quarter from the December quarter of 2022, with the annual rate to March at 2.3%. There will be at least one negative quarterly reading in 2023, probably the September quarter, although a line ball reading is likely in the June quarter. A technical recession is a distinct possibility before the June quarter of 2024.
The outlook for household consumption, which is the largest contributor to GDP, is the major influencing factor. Interest rate hikes of the past and likely further increases, combined with the refinancing of ultra-low fixed rates to current elevated levels will meaningfully reduce the disposable income of indebted households. It will not stop the well-off or the debt-free from spending and holidaying. The 80/20 rule is working—mortgagees and renters representing most of the 80%.
We forecast growth in household consumption of less than 0.5% in 2023 and below 1% in 2024, with a negative reading probable in the June half of 2024, before a recovery in the December half. On a more dire note, on a per capita basis, we anticipate recession in both household consumption and GDP growth in both 2023 and 2024.
Helping to offset a subdued household consumption contribution, both business investment and government spending are expected to be supportive of GDP, underpinned by meaningful energy transition-related infrastructure. Investment in affordable housing is likely to start contributing later in 2024, at the earliest. Skilled labour shortages will remain an issue.
So far, the fall in housing prices from sharply higher interest rates appears to have run its course, limiting the downside impact of a falling ‘wealth effect’, with a housing shortage and sharply increased immigration offsetting factors.
Inflation remains a concern. The monthly CPI indicator for year to May was a belter, rising 5.6%, well below expectations of 6.1% and down sharply from April’s equally surprising 6.8%. The market reaction was positive, with both equity and bond prices rising, yields falling. The rises appear somewhat short-sighted. While it may have influenced the Reserve Bank (RBA) to pause or skip on 4 July, it does not mean the central bank’s rate hiking journey is over. Services inflation is not dead, far from it.
Unemployment is forecast to rise in the December half of 2023 and into 2024 from the current 3.6%, possibly reaching 5% by end 2024. The lack of any improvement in labour productivity will remain a drag on GDP growth in the near term. The RBA’s assistant governor recently suggested the unemployment rate would need to lift to 4.5% if the trimmed mean inflation target range of 2–3% by mid-2025 was to be achieved (Exhibit 3). This also assumes the participation rate remains at a record 66.9%. It looks optimistic.
Exhibit 3: Labour market outcomes* (%)
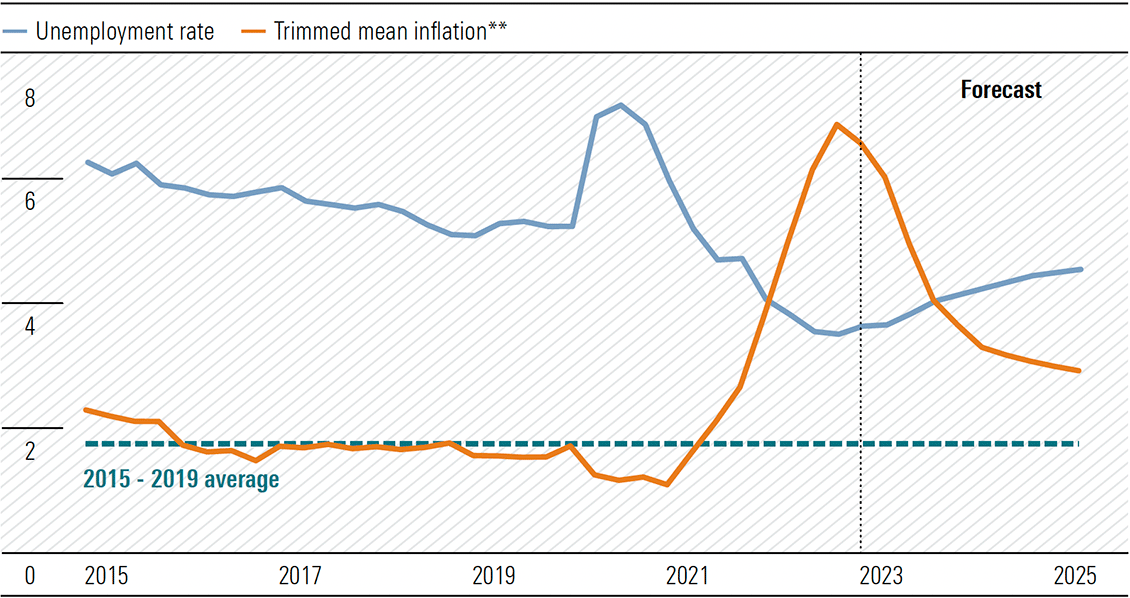 *Forecasts are as at the May 2023 Statement on Monetary Policy. **Year-ended. Sources: ABS, RBA.
The RBA’s Financial Aggregates released on 30 June reveal a continued slowing in credit growth in May, extending the deterioration to seven consecutive months since October 2022. Credit provides the leverage to the economy. It reflects the level of confidence of both household and business sectors and is a reliable indicator of future economic activity. Expanding credit growth signals increasing confidence, declining credit growth the opposite.
Exhibit 4: Financial Aggregates – percentage change
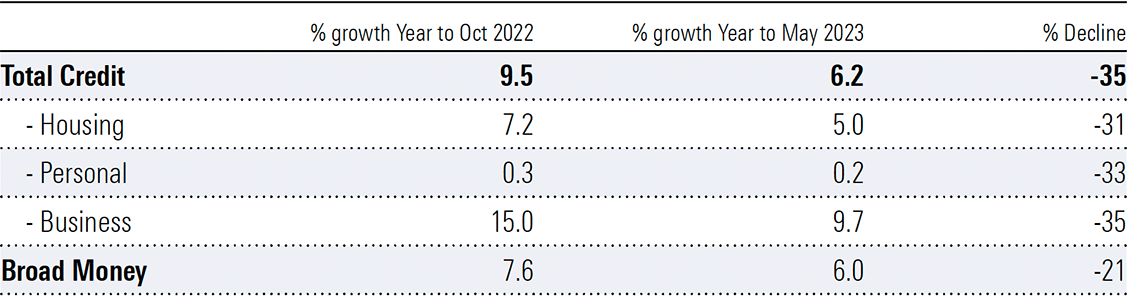 Source: Reserve Bank of Australia
Therefore, it was not surprising the National Australia Bank’s (NAB) Monthly Business Survey for May revealed worrying signs of slowing activity. There were notable declines across the trading, profitability, and employment sub-sectors, with the fall in conditions accelerating. While marginally ahead of the long-run average, results are considerably below those of early 2023.
Business confidence fell to -4, with most industries in negative territory. Forward orders were sharply lower reflecting slowing demand and particularly evident in the consumer sector. Retail and wholesale are the weakest of all industries. Remember, household consumption is the most important contributor to GDP, underpinning 60–65% of the total monetary value of all finished goods and services produced in the economy.
While the Westpac-Melbourne Institute Consumer Sentiment Index is showing signs of bottoming around the lows reached in 2022, and those of the late 1980s-early 1990s recession, it is hardly a reason to break out the champagne. The index edged marginally higher from 79 in May to 79.2 in June. The survey was taken between 5–9 June and while improvement is encouraging, there was a sharp decline in confidence from respondents after the RBA’s rate hike on 6 June. Clearly, the surprise element in the timing of the increase and the subsequent hawkish tone of RBA governor Philip Lowe’s commentary hit home.
Additionally, there was a meaningful lift in unemployment expectations, with the sub-index increasing to the highest level since September 2020. Given the traditional lag effect, the unemployment rate could move sharply through 4% by early 2024.
Exhibit 5: Unemployment expectations rose sharply
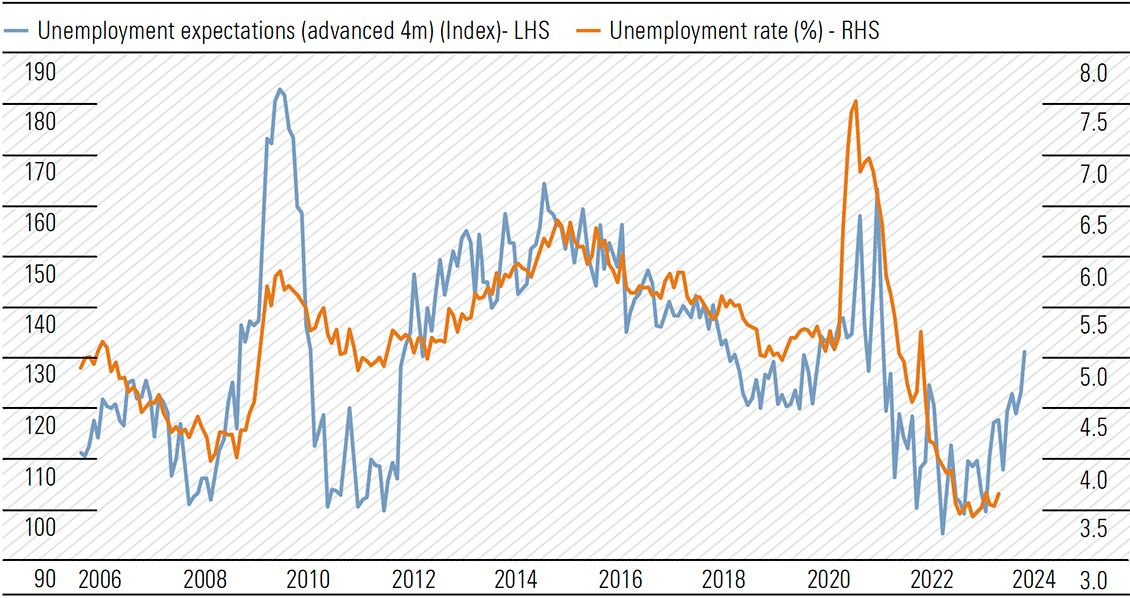 Source: National Australia Bank, Macrobond
Both the NAB and Westpac surveys frank the credit growth deterioration evident in the RBA’s Financial Aggregates.
On the doorstep of the mortgage cliff
At the bottom of the interest rate cycle and with the RBA governor proclaiming interest rates will not rise until 2024 at the earliest, the demand for fixed loan mortgages soared. The favourable interest-rate conditions drove fixed-rate mortgages as a proportion of new lending to a peak of 46% in July 2020. RateCity research reveals the big four banks have over $150bn of fixed rate loans requiring refinancing between July and December 2023. Currently, around 40% of all mortgage loans taken out between 2020 and 2021 are fixed, some were secured below 2%. The honeymoon is about to turn into a nightmare.
While these fixed loans are not a large portion of the bank’s mortgage loan portfolios, the pain will affect bank credit impairments, while net interest margins are already under pressure. And pressure from another source is also on the way.
At the height of the pandemic, the RBA introduced two major policy responses, the Yield Curve Control (YCC) asset purchases and the Term Funding Facility (TFF). The latter was established to offer low-cost three-year funding to authorised deposit-taking institutions (ADIs) and had two objectives:
- to reinforce the benefits to the economy of a lower cash rate, by reducing the funding costs of ADIs and in turn helping to reduce interest rates for borrowers;
- to encourage ADIs to support businesses during a difficult period, ADIs could access additional low-cost funding if they expanded their lending to businesses. The scheme encouraged lending to all businesses, although the incentives were stronger for small and medium-sized enterprises (SMEs).
The total available under the TFF was $213bn of which $188bn was drawn down. The big four banks collectively drew $133bn, $63bn in the initial allowances at 0.25% and $70bn at 0.10% in the supplementary round. These were three-year loans, the initial allowances maturing on 30 September 2023 and the supplementary on 30 June 2024. They did not require any marketing expenses and presumably no capital was invested when TFF funds were on-lent. It is likely net interest margins have been supported to some extent since 1 July 2020.
On 30 September 2023, the big four will have to repay $63bn to the RBA and on 30 June 2024 $70bn. The banks will need to invest equity on a risk-weighted basis and fund the remainder via retail/business deposits and the wholesale market. The transition could be an interesting spectacle.
Between now and 30 September the four major banks will be corralling $63bn—Commonwealth Bank $19.2bn; Westpac $17.9bn; National Australia Bank $14.3bn, and ANZ $12bn. This is not an insurmountable task but will have margin implications. On 19 June, Westpac priced 5-year and 10-year Tier 2 hybrids at 6.5% and 6.9%, respectively. That is a long way from the 10–25-basis points of the TFF loans provided by the RBA.
Markets likely to struggle
In the September quarter (3Q23), the domestic market is likely to be focused on the FY23 results season. Some 170 companies in the S&P/ASX 200 index will report. Results must be lodged before close of business on 31 August and the outlook statements will be critical and closely monitored.
Attention will also focus on key domestic economic data including inflation, labour force, and retail sales, monitoring the pulse of household spending. The inflation readings for the June quarter and Monthly CPI Indicators for July and August along with monetary policy decisions of the RBA on 8 August and 5 September are likely to influence the market performance.
Economic growth slowed from 0.6% in the December quarter 2022 to 0.2% in the March quarter 2023. We expect further weakening in the June quarter and a contraction is on the cards for the September quarter. Consumer sentiment has collapsed (Exhibit 6) and against this backdrop, corporate profit growth will have slowed in the June half, particularly in the sectors reliant on household spending. Price rises have lagged the rate of cost increases, putting margins under pressure, while volume growth has also declined as households tighten belts.
Exhibit 6: Consumer Sentiment* average since 1980 = 100
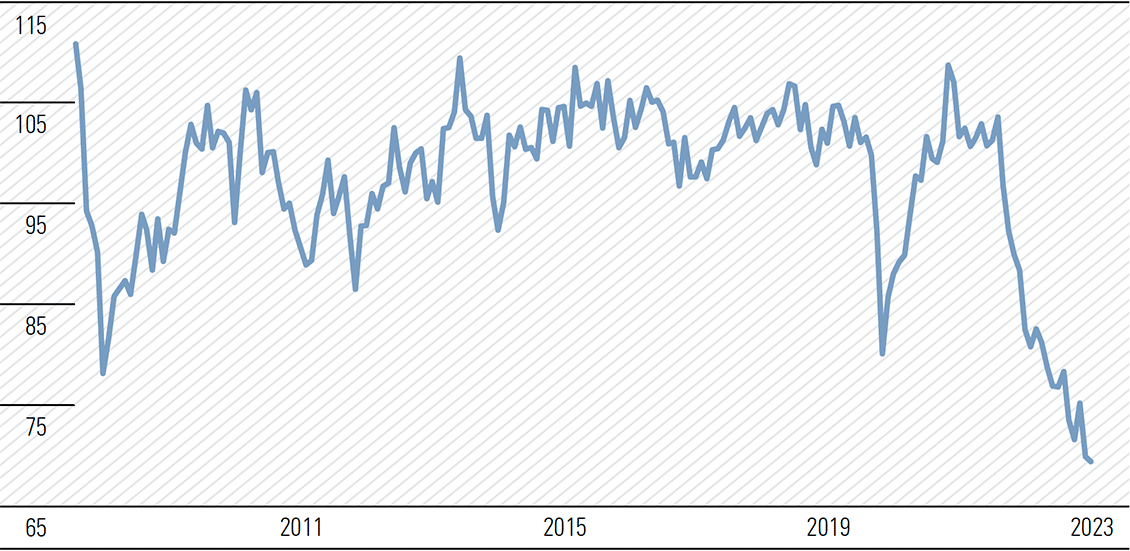 * Average of the ANZ-Roy Morgan and Westpac-Melbourne Institute consumer sentiment measure of respondents’ perceptions of their personal finances relative to the previous year; ANZ-Roy Morgan index rescaled to have the same average as the Westpac-Melbourne Institute index since 1996.
Sources: ANZ-Roy Morgan; RBA; Westpac and Melbourne Institute.
* Average of the ANZ-Roy Morgan and Westpac-Melbourne Institute consumer sentiment measure of respondents’ perceptions of their personal finances relative to the previous year; ANZ-Roy Morgan index rescaled to have the same average as the Westpac-Melbourne Institute index since 1996.
Sources: ANZ-Roy Morgan; RBA; Westpac and Melbourne Institute.
As rising interest rates increase debt servicing commitments, the disposable income of indebted households is under pressure. The savings buffer from massive fiscal stimulus programs in 2020 and 2021 has depleted quickly (Exhibit 7) and household consumption is being curtailed. Discretionary retailers are feeling the pinch and the online channel, which has a greater proportion of impulse spending, appears to be suffering most.
Exhibit 7: Household income and consumption* (%)
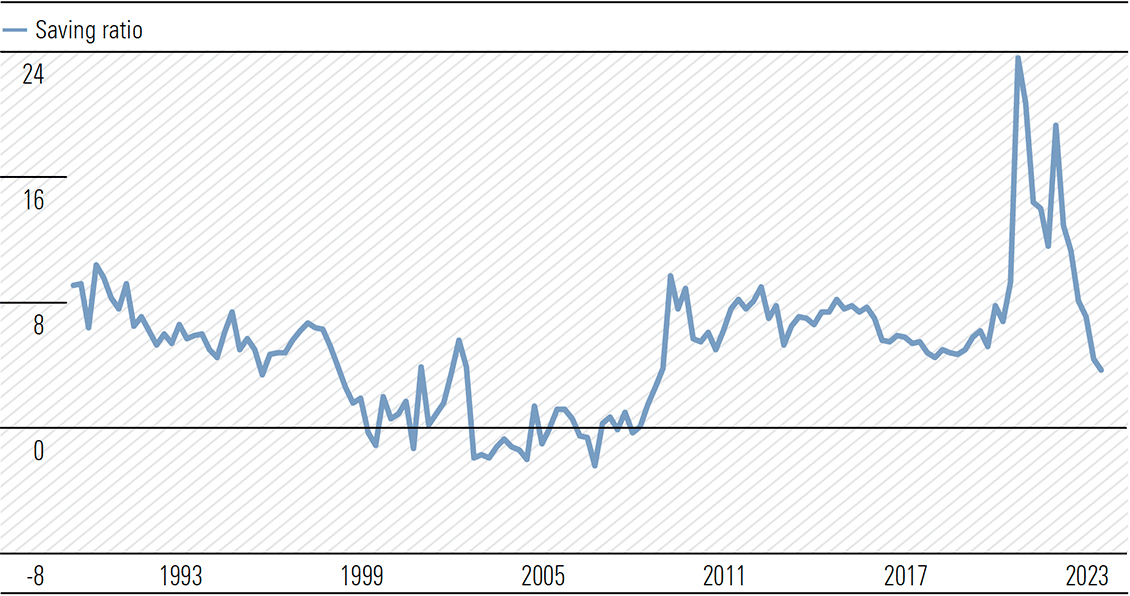 * Household sector includes unincorporated enterprises; disposable income is after tax and interest payments; saving ratio is net of depreciation.
Sources: ABS; RBA.
* Household sector includes unincorporated enterprises; disposable income is after tax and interest payments; saving ratio is net of depreciation.
Sources: ABS; RBA.
Financial Services and Basic Materials represent 50% of the Australian share market benchmark index, the S&P/ASX 200. Given the high level of concentration, where these sectors go, so goes the Australian market. Financial Services is dominated by the four major banks. BHP is the lighthouse of Basic Materials.
Despite the boost to interest income from rising interest rates, bank net interest margins are under pressure from the higher cost of funds in both the wholesale and retail markets, as bond yields remain elevated, and depositors demand higher rates. While, well provisioned, the banks will experience rising credit impairments. Sluggish commodity prices are having an impact on the revenues of resource and energy companies, while inflation pushes costs meaningfully higher. Focus will be on the extent and effect of Chinese stimulus.
The outlook for fiscal 2024 is for moderating growth in corporate profitability. In many cases earnings may decline as household consumption growth stalls and could well contract in the current half to December 2023.
Technology was the best performing sector in the year to 30 June 2023 with a 27% gain as Australian companies were caught up in the AI mania. The sector was led by WiseTech which is now the 16th largest Australian company by market capitalisation, Xero, and Technology One. The performance of the sector hardly moved the needle of the S&P/ASX 200. The total market capitalisation of the three companies is just shy of $50bn (US$33bn). To put this in context, Apple has authorised another US$90bn share buyback for 2023 after completing repurchases of US$90bn in 2022.
We expect a subdued market performance in the current quarter, although July is traditionally a stronger month as funds are reallocated for the new financial year. After a 9.7% lift in the year to 30 June 2023, the S&P/ASX 200 is not expected to break meaningfully above 7,500 before June 2024, but a move to the downside around 7,000 would not surprise.
UNITED STATES
Markets looking toppy, particularly the techs
The almost cult-like following of all things embracing artificial intelligence has propelled US markets in the six months to 30 June. The Nasdaq Composite soared almost 32% in contrast to the near 16% of the S&P 500 and a pedestrian 3.8% of the Dow Jones Industrial Average. Morningstar’s Chief US Market Strategist David Sekera now asks, ‘Time to batten down the hatches or raise the sail?’
According to a composite of the over 700 stocks we cover that trade on US exchanges, as of 26 June, the US equity market was trading at a price/fair value of 0.95, representing a 5% discount to our fair value estimates.
Growth stocks have risen 23.4% year-to-date, well outperforming the 13.2% increase across the broader market. As such, the growth category is now trading near fair value, whereas it was the most undervalued style at the beginning of the year. At this point, investors appear best positioned by overweighting the value category and underweighting core and growth categories, both which are trading near fair value.
Large-cap stocks have also outperformed this year, rising 16.0%, and are now trading slightly closer to fair value than the broader market. Mid-cap and small-cap stocks both remain at much greater discounts to fair value.
Looking ahead, we expect the rate of economic growth will slow sequentially in the third and fourth quarter then bottom out in the first quarter of 2024. While we continue to view the broad market as undervalued, between slowing economic growth, tight monetary policy, and reduced credit availability, we suspect the rate of market gains will be limited over the next few quarters.
Sekera suggests it is time to underweight the overvalued technology sector. It will be interesting to see the outcome should exchange traded funds also heed his advice and head for the door.
The stock market rally has been unusually concentrated this year. According to an attribution analysis of the Morningstar US Market Index, the returns from only seven stocks account for almost three quarters of the total market return thus far this year. The seven stocks—The Magnificent Seven—are Apple, Alphabet, Amazon, Meta, Microsoft, Nvidia, and Tesla.
Excitement surrounding the emergence of artificial intelligence, specifically natural language processing tools, such as ChatGPT, drove stocks significantly higher for any companies that may stand to benefit from the future implementation of this technology. Who is going to solve the problems when artificial intelligence fails to deliver as promised? I recall the damage synthetic (artificial) derivatives did during the GFC.
With the CNN Fear & Greed Index in Extreme Greed territory and the 2-year/10-year and 2-year/30-year yield curve at the deepest inversion since 1980, the amber lights are flashing.
Housing on the turn
The spring selling season for homebuilders, typically viewed as January-April, was better than expected, with cumulative new home sales declining roughly 10% year-over-year (y/y) compared with a more than 26% decline for existing home sales. New home sales improved sequentially to April, and April sales increased 11% y/y. May was even better, with new-home sales increasing 20%.
Two factors likely explain the relative strength of the new home market. First, homebuilders addressed affordability challenges with sales incentives including base price reductions and smaller floor plans. Second, over 90% of outstanding mortgages have a contract interest rate below 5%, according to the Federal Housing Finance Agency, which discourages listing existing homes. As a result, more would-be buyers are turning to the new-construction market.
Considering the better-than-expected spring selling season, we forecast total housing starts to decline 17% in 2023 to 1.295 million units, with single-family starts 18% lower to 825,000 and multi-family starts down 14.5% to 470,000 units. Previously, we forecast total starts to decline 22%. However, May housing starts were stronger than expected. If this trend continues, there could be upside to our starts forecast
Exhibit 8: We forecast a down year for residential construction in 2023 but see a rebound beginning in 2024 (Thousands of units)
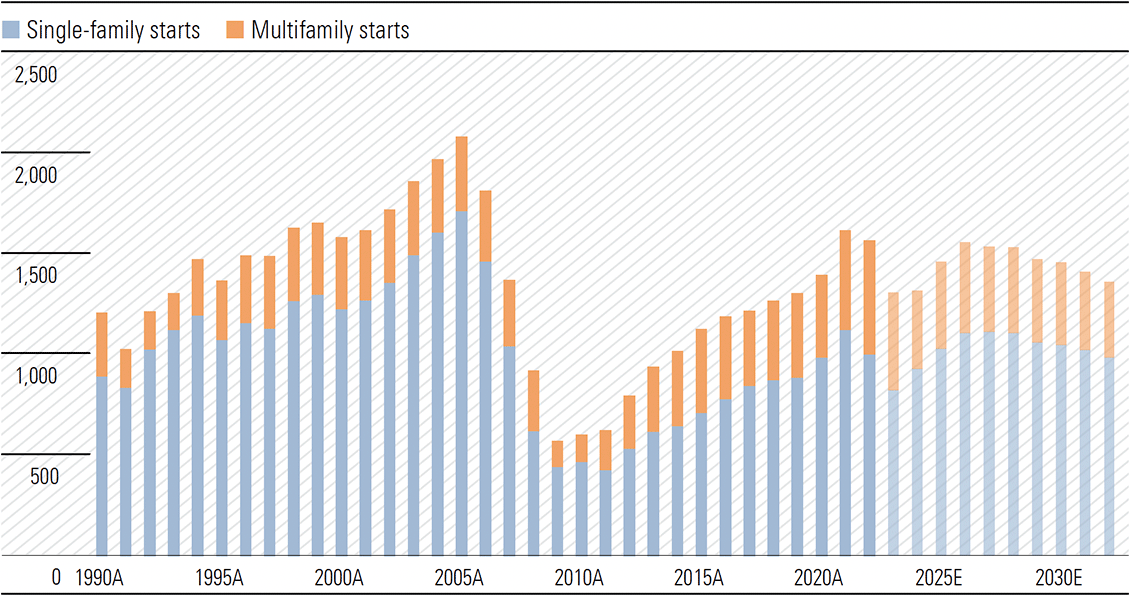 Source: U.S. Census Bureau, Morningstar
We expect housing starts will begin to rebound in 2024 as lower mortgage rates and home prices improve affordability and entice more single-family buyers back into the market. We project housing starts will rebound 1% in 2024 as a 13% increase in single-family starts to 930,000 units is mostly offset by a 20% decline in multi-family starts to 375,000 units. After two years of near-record multi-family construction, we project a step down in 2024 as the market digests the new supply.
However, for 2024–26, we expect high-single-digit growth for both single and multi-family construction, with total housing starts eclipsing 1.5 million units by 2026. Over a longer horizon, we think an annual production pace of about 1.3–1.4-million units is a reasonable assumption.
While we still expect home prices to decline in 2023, recent price resiliency caused us to moderate our price outlook. Based on our forecast sales mix, we expect the median blended home price to decline 3% in 2023. After modest declines in 2023–24, we continue to see home price appreciation returning to the long-run trajectory of approximately 3%–4%. (Brian Bernard Director, Industrials Morningstar Chicago)
Commercial real estate remains an issue
All appears quiet on the regional banking sector after the failures of Silicon Valley Bank and Signature Bank and the bail out/sale of First Republic to JP Morgan. However, there are signs the commercial real estate sector remains in trouble across office and retail.
Reports indicate one in five office buildings are vacant across the country. In San Francisco near 30% of offices are empty. The pre-pandemic vacancy rate was 3.7%.
Walmart is closing half of its eight stores in Chicago where it has failed to make money after 17 years of trying. It is also closing its last remaining stores in Portland. The reason, record breaking thefts.
Investors are shunning the office market and New York’s Manhattan is a bellwether with purchases of US$490m in the March quarter from US$5bn in the same three months of 2022. Year-to-date, the average acre of land sold on Manhattan is near US$68m, down 57% from the same period in 2022 and from US$280m in 2019.
At present there are about US$11 trillion in commercial loans outstanding. With high and growing vacancy rates, landlords become nervous as cash flow dries up and the debt needs to be serviced or the keys are dropped off to the bank. Valuations are under increasing pressure and the sector needs close monitoring. Coincidently, the US$11 trillion in outstanding commercial property loans equals the combined market capitalisations of The Magnificent Seven!
Disturbing
The newly elected president of United Auto Workers (UAW) union Shawn Fain has come out with a barrage of fighting words. “We’re here to come together to ready ourselves for the war against the one and only true enemy: multibillion-dollar corporations and employers who refuse to give our members their fair share. It’s a new day in the UAW … the fighting UAW is back.”
Will this rather aggressive stance have any implications for wage demands?
EUROZONE
Already in a technical recession, Germany next?
This time last year the European Central Bank (ECB) had not raised interest rates. The shape of the German bund yield curve was normal, with the short end yields meaningfully lower than the long end. This was almost six months after Russia invaded Ukraine inflicting a serious blow to the eurozone economy. Consumer confidence was shattering across the region. A year later, the entire German bund yield curve has inverted (see Exhibit 1), and to its most inverted level since 1992. The ECB has also followed other central banks, hiking aggressively and still retains a hawkish bias.
The final Manufacturing Purchasing Managers’ Index (PMIs) for the Eurozone was revised lower from the earlier flash reading of 43.6 to 43.4, at a 37-month low. The final German PMI was revised from 41.0 to 40.6, with S&P Global reporting output and new orders both fell at the fastest rate in eight months. Employment growth is close to stalling as the outlook darkens and factory gate prices fell for the first time since September 2020. “Overall, the PMI data for manufacturing show that a recession in this sector, which was still expanding in the first quarter according to GDP statistics, has become much more likely.”
Meaningfully higher interest rates have impacted Germany’s commercial real estate market with deal volumes slumping 50% in the June half to €14.9bn from the six months to December 2022. Weakness is likely to continue as the ECB’s rate hiking is not finished and falling valuations will increase the likelihood of defaults impacting banks.
The Eurozone weathered the fallout from Russia’s invasion of Ukraine better than most expected. The energy crisis has been well managed. While the economy has experienced a mild technical recession (Exhibit 9), it has avoided a severe contraction feared by many a year ago. Labour markets have remained robust which has helped stabilise consumer spending and economic sentiment has improved. However, inflation remains too high, meaning the ECB has more rate hikes in store. Geopolitical uncertainty remains elevated hampering business investment.
Exhibit 9: Euro area GDP growth rate (%)
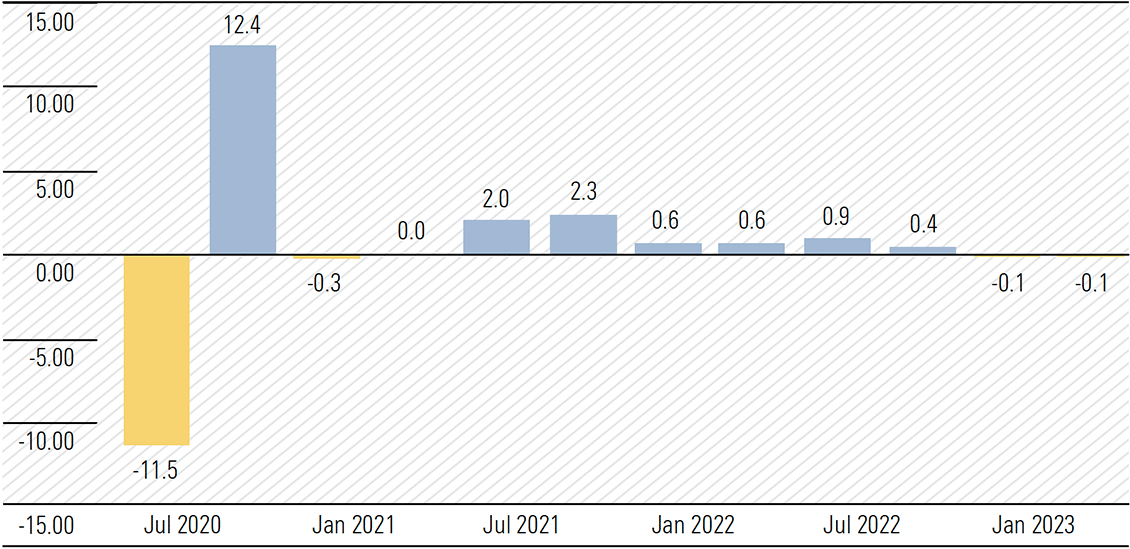 Source: www.tradingeconomics.com, Eurostat
The European Commission forecasts GDP growth of 1% in 2023, which could be a little optimistic, and with inflation running at 6%, which will be a burden. The outlook for 2024 is dependent on foreign demand with hopes relying on the US and China. A period of subdued economic activity is likely through 2024, with momentum gathering in the second half.
CHINA
Can authorities pull a rabbit out of the hat in 2023?
2023 is the Year of the Rabbit and the world will be hoping Chinese authorities can pull one out of the hat. Can they stimulate the economy to revive a stalling rebound following the reopening of the economy in January after the lifting of zero-tolerance restrictions.
After a solid opening to 2023, with 1Q GDP growth of 4.5%, growth in the key partial components of industrial production, retail sales and fixed asset investment slowed in April and May (Exhibit 10). Industrial company profits fell 13% in May from a year earlier. The premier Li Qiang has reassured markets 2Q GDP growth will beat Q1 and the economy is on track to achieve the official growth target of “around 5%” in 2023.
Exhibit 10: China—activity indicators. Year-ended growth
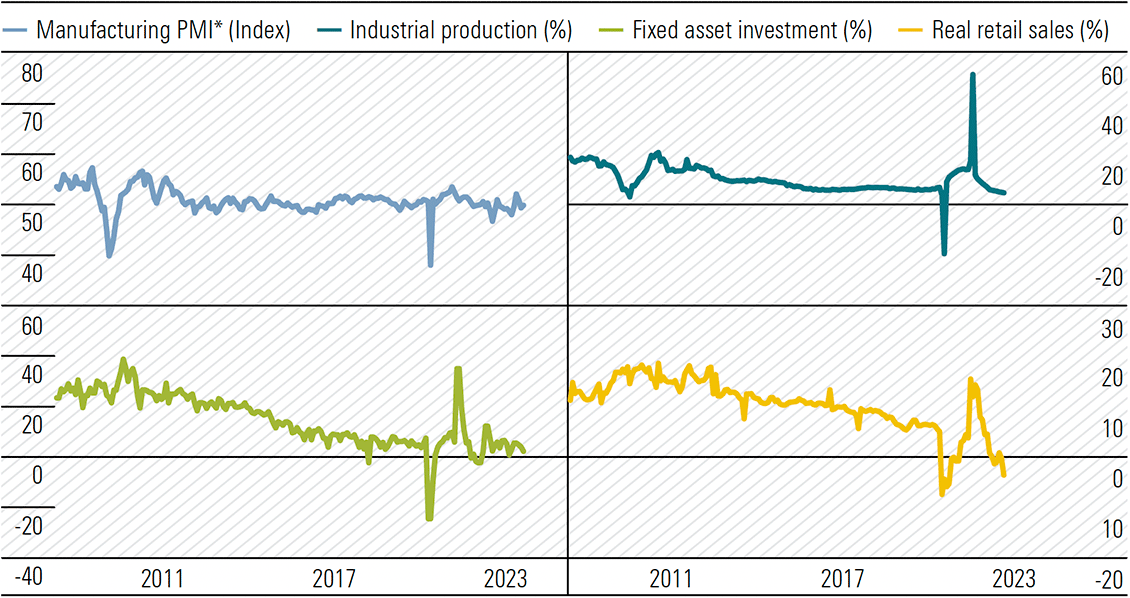 * Diffusion index; average of the official and Caixin.
Sources: CEIC Data; Markit Economics; RBA.
* Diffusion index; average of the official and Caixin.
Sources: CEIC Data; Markit Economics; RBA.
The PMIs for June are suggesting the June quarter will close on a weak note, with the services sector causing concern. The official nonmanufacturing PMI, which includes both services and construction activity, declined from 54.5 in May to 53.2. The services only sub-index eased from 53.8 to 52.8. The private Caixin/S&P Global services PMI revealed a greater fall from 57.1 to 53.9 to the slowest pace in since January after coronavirus swept the country following the lifting of zero-tolerance policy. Both business activity and new orders experienced slowing growth, while new export orders expanded at a solid pace, albeit slightly lower than in May.
The gradual transition from a fixed asset investment and export driven economy to one more focused on domestic consumption is likely to be stepped up. Polices supporting both the consumer and businesses is expected to be forthcoming. So far, interest rate cuts have been modest and further and more meaningful moves are likely.
The private sector needs more encouragement, and we expect authorities to adopt a more supportive stance with a meaningful fiscal injection to revive private sector and consumer activity and lift domestic consumption. Authorities do not have the inflationary concerns of western developed economies, with annual CPI at 0.2% in May and negative PPI readings for eight consecutive months.
While markets appear somewhat pessimistic, we believe GDP growth nearer 6% is possible in 2023 and consolidation in 2024 around that mark. Dominance in specific markets in the quest for global energy transition to renewables, including solar panels and lithium-ion batteries will ensure a healthy trade surplus is maintained, supporting increased domestic consumption.
—Peter Warnes
ENERGY
OPEC+ production cuts look to defend price and create supply deficits
OPEC+ production cuts are expected to tighten the market, driving supply deficits in the second half of 2023, supporting higher oil prices. After a lengthy period of producing well above OPEC quotas, it looks like Russian production is now within compliance. With US producers unwilling to respond, OPEC+, led by Saudi Arabia, is emboldened to protect price without fear of market reprisals. The US is not responding with materially higher production in the short run, due to the time it takes to see results from drilling, and ongoing producer discipline. Estimated supply for the full year has declined 110 million barrels per day (mb/d) since March, mainly due to OPEC+ cuts. Meanwhile, the Energy Information Administration (EIA) now expects 2023 demand to be about 100 mb/d higher than in March, as Asian demand, primarily in China, has exceeded earlier expectations.
OPEC+ announced substantial production cuts for 2023 and 2024. In April, it surprised with voluntary cuts from several member countries, meaning quotas were not adjusted but volumes will decline by 1.7 mb/d in total. These voluntary cuts were initially scheduled to unwind at the end of the year. However, reports suggest they were extended through 2024 at the 4 June ministerial meeting. Official quotas were also reduced on 4 June by 1.4 mb/d, and tweaked on 13 June with an increase to Russia’s quota, ostensibly pushing the combined curtailment next year to 2.9 mb/d.
However, because several members have been persistently struggling to deliver their quotas, the 2024 adjustment merely aligns these countries’ targets with their capacities. Adjusting for this underperformance, Morningstar pegs the realistic impact of the combined cuts on 2024 volumes at around 1.1 mb/d.
OPEC+ announcements did buoy crude prices temporarily. But market enthusiasm has waned on concerns about the global economy, and Brent prices near US$75 per barrel are currently about 10% lower than the start of April. This has likely frustrated the Saudis, under growing pressure to keep prices above US$80 a barrel to ensure enough revenue to fund planned social spending. This was probably the motivation for the “Saudi lollipop,” an additional temporary cut of 1 mb/d Saudi Arabia will implement unilaterally in July 2023, which was announced shortly after the 4 June meeting.
All up, the Brent price remains above our unchanged US$60 per barrel mid-cycle estimate from 2025. So too Asia LNG at US$12 per mmBtu, sits above our unaltered mid-cycle estimate of US$8.40 per mmBtu. And Australian energy stocks remain undervalued. We still expect upstream oil and gas company earnings in 2023 to approximately halve on 2022 levels. But this should not translate to weaker share prices. Energy commodity prices are still very healthy for the likes of Woodside and Santos. They can earn favourable margins even at considerably lower prices than current in support of their expansion aspirations.
Longer term we still see secular demand decline for oil is on the horizon, but we think the market is probably too bearish about both the timing and the severity of it. We think global demand will creep higher in the next few years, rather than collapsing. And when it does start to decline, in the early 2030s, in our base case, the rate will be modest because the impact of the rapid proliferation of electric vehicles that we expect will be offset by growing demand for jet fuels and petrochemicals.
And especially important for gas-heavy Australian E&P’s natural gas as an energy transition commodity, demand will be strong and growing for peaking requirements. All this gives Australian E&P’s a multi-decade runway to maintain and grow their operations and continue generating robust free cash flows, much of which we think will be funnelled back to shareholders via buybacks and dividends.
—Mark Taylor