In recent years, fund managers have received a lot of bad press for their performance versus benchmark indices.
In a Firstlinks editorial in October, I wrote of S&P Global’s new SPIVA report, which showed Australian fund managers performed better in the first half of the year, with most outperforming indices in local equities, small and mid-caps, and bonds. But their results were less impressive over longer periods.
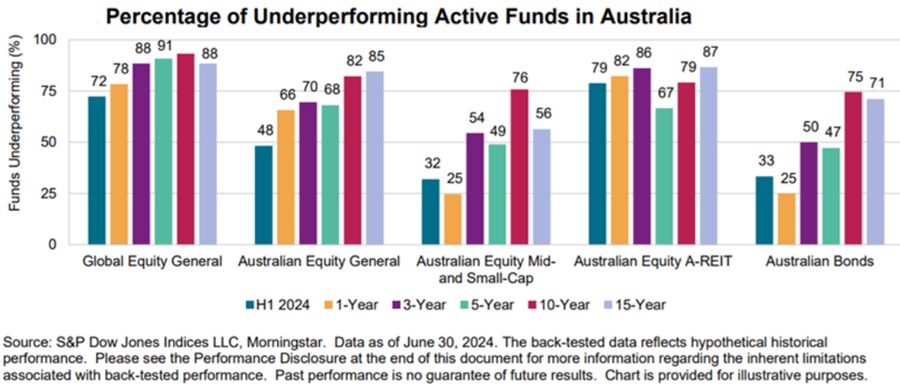
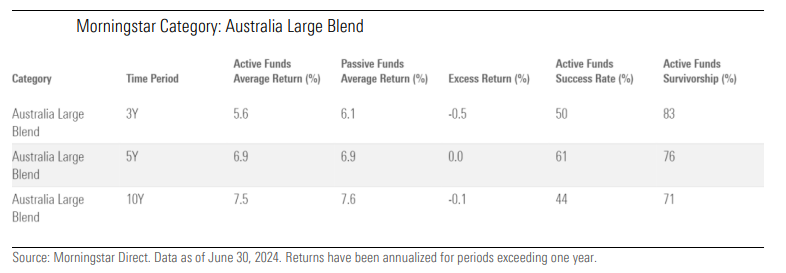
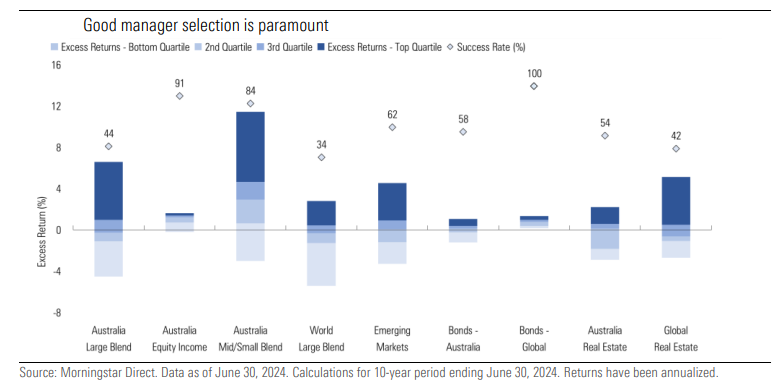 Some categories of fund managers did better than others. In the prominent ‘Australia Large Blend’ category, active funds performed worse over the past 10 years, better over five years, and were evenly split in the prior three years. Put simply, large cap managers have had periods of outperformance and underperformance.
 Mid and small cap managers fared better. They performed in line with passive funds over three years, but significantly outperformed over longer periods. And, most of these managers beat passive across every timeframe.
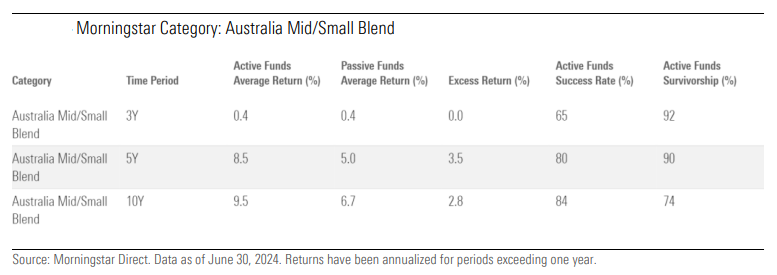 This would suggest that there’s value in managers who can find pricing discrepancies in relatively under-researched mid and small caps.
Similarly, Australian equity income has been a favourable area for active managers. They’ve had excess returns across all timeframes.
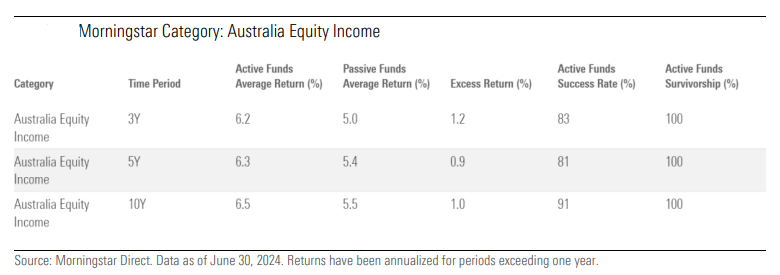 Most dividend-focused passive funds have strict rule-based mandates. It seems that active funds with more flexibility can generate significant outperformance in this space.
Investing overseas has been more of a problem for Australian equity managers. In the ‘World Large Blend’ equity category, passive dominates active funds. Undoubtedly, increasing market concentration, aka ‘The Magnificent Seven’, has made it more difficult for active managers to keep up with the performance of comparable passive funds.
 In fixed income, fund managers have added value both in Australian and global bonds. In local bonds, most managers have beaten passive counterparts over three, five and 10 years. Excess returns have been more positive in recent years with the normalization of the yield curve.

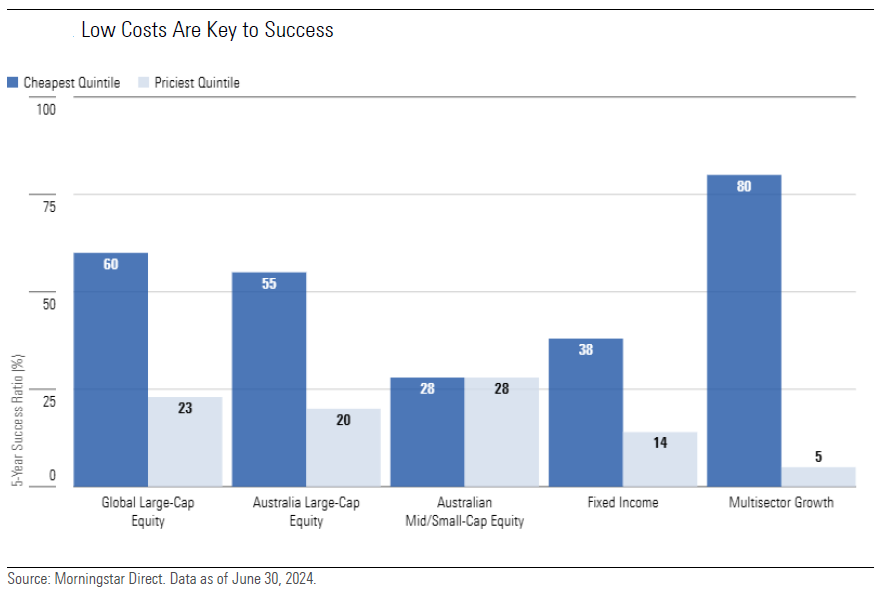 In four out of five categories, the cheapest quintile of funds, both managed and passive, produced better results than the priciest quintile over the trailing five years.
Breaking that down further, in Global Large-Cap Equity, 68% of the funds in the lower quintile of fees outperformed their category group. These funds had average expense ratios of 0.46%. And their average annualized total return was 11.73% in the five years to June 30, 2024.
That compares to funds in the highest quintile of fees, where only 23% beat the category group, with average annualised returns of 8.05%, and expense ratios of 2.58% being a key drag on performance.
In Australian mid and small cap equity, fees weren’t as big a factor in overall results. The success ratio of the cheapest and priciest quintile was equal at 28%. Perhaps this suggests cheaper isn’t better when it comes to selecting small cap managers, and it may be worth paying up for good ones.
Fees were a larger factor for fixed income managers. Yet the spread between the cheapest quintile’s success ratio and the most expensive was smaller than for other asset classes. The cheapest quintile’s success ratio of 38% compared to the 14% of the priciest quintile.
The report says that active managers in fixed income tend to underperform indices in risk-off conditions while outperforming in more sanguine markets. That’s because the managers tend to overweight corporate credit relative to the index, where conventional benchmarks have a considerable skew to government and government-related bond issuance.
The report goes on to suggest that “although active fixed income managers are often able to outperform the index gross of fees, the outperformance does not always compensate for the corresponding fees.”
The largest disparity between the cheapest and priciest quintile of fund managers was in the multisector growth category. Here, the cheapest quintile recorded a success ratio of 80% compared to the most expensive quintile’s 5%. The dispersion in fees was comparable to other asset classes with the cheapest charging an average 0.56% compared to the dearest’s 2.53%.
In sum, cost is a big predictor of managed fund returns and should be a key consideration for investors.

Active vs passive
In a new report, Morningstar has measured fund managers’ success relative to the net-of-fee performance of comparable passive funds, rather than an index. And it turns out that active managers stack up pretty well. The study spanned more than 800 open-ended fund strategies across nine different categories. It found that the top quartile performers in every category have generated positive excess returns over their passive counterparts in the trailing 10-year period. Some categories of fund managers did better than others. In the prominent ‘Australia Large Blend’ category, active funds performed worse over the past 10 years, better over five years, and were evenly split in the prior three years. Put simply, large cap managers have had periods of outperformance and underperformance.
 Mid and small cap managers fared better. They performed in line with passive funds over three years, but significantly outperformed over longer periods. And, most of these managers beat passive across every timeframe.
 This would suggest that there’s value in managers who can find pricing discrepancies in relatively under-researched mid and small caps.
Similarly, Australian equity income has been a favourable area for active managers. They’ve had excess returns across all timeframes.
 Most dividend-focused passive funds have strict rule-based mandates. It seems that active funds with more flexibility can generate significant outperformance in this space.
Investing overseas has been more of a problem for Australian equity managers. In the ‘World Large Blend’ equity category, passive dominates active funds. Undoubtedly, increasing market concentration, aka ‘The Magnificent Seven’, has made it more difficult for active managers to keep up with the performance of comparable passive funds.
 In fixed income, fund managers have added value both in Australian and global bonds. In local bonds, most managers have beaten passive counterparts over three, five and 10 years. Excess returns have been more positive in recent years with the normalization of the yield curve.

Managed fund fees are a key predictor of future returns
In a separate report, Morningstar has updated previous work which showed that fees were a reliable predictor of the future success of a fund. The report confirms that lower-cost funds in Australia have a greater chance of outperforming their more expensive peers, as the chart below indicates. In four out of five categories, the cheapest quintile of funds, both managed and passive, produced better results than the priciest quintile over the trailing five years.
Breaking that down further, in Global Large-Cap Equity, 68% of the funds in the lower quintile of fees outperformed their category group. These funds had average expense ratios of 0.46%. And their average annualized total return was 11.73% in the five years to June 30, 2024.
That compares to funds in the highest quintile of fees, where only 23% beat the category group, with average annualised returns of 8.05%, and expense ratios of 2.58% being a key drag on performance.
In Australian mid and small cap equity, fees weren’t as big a factor in overall results. The success ratio of the cheapest and priciest quintile was equal at 28%. Perhaps this suggests cheaper isn’t better when it comes to selecting small cap managers, and it may be worth paying up for good ones.
Fees were a larger factor for fixed income managers. Yet the spread between the cheapest quintile’s success ratio and the most expensive was smaller than for other asset classes. The cheapest quintile’s success ratio of 38% compared to the 14% of the priciest quintile.
The report says that active managers in fixed income tend to underperform indices in risk-off conditions while outperforming in more sanguine markets. That’s because the managers tend to overweight corporate credit relative to the index, where conventional benchmarks have a considerable skew to government and government-related bond issuance.
The report goes on to suggest that “although active fixed income managers are often able to outperform the index gross of fees, the outperformance does not always compensate for the corresponding fees.”
The largest disparity between the cheapest and priciest quintile of fund managers was in the multisector growth category. Here, the cheapest quintile recorded a success ratio of 80% compared to the most expensive quintile’s 5%. The dispersion in fees was comparable to other asset classes with the cheapest charging an average 0.56% compared to the dearest’s 2.53%.
In sum, cost is a big predictor of managed fund returns and should be a key consideration for investors.


